Statistical bioinformatics methods can be applied to any set of biological data, not just NGS data.
In addition to individual data sources, integration of multiple data types allows access to knowledge that would be impossible to gather from any one type of dataset alone.
READ ABOUT THE DIFFERENT ANALYSIS WE OFFER BELOW
Functional analysis has become the first choice for gaining insight into the underlying biology of differentially expressed genes and proteins since it helps interpret the data in the context of biological processes, pathways and networks. Genes involved in the same biological processes, functions, or localizations usually present correlated behaviours in terms of expression levels, signal intensities, allele occurrences, and so on. We can therefore apply statistical tests to find perturbed functions or pathways. Commonly, the two sources of information for this type of analysis are the Gene Ontology (GO) knowledgebase and a complete free database of metabolic pathways such as the Kyoto Encyclopedia of Genes and Genomes (KEGG). We offer the following analysis: Given an input list of differentially expressed genes under certain conditions, an ORA will test which GO terms/pathways are over or under-represented using public annotation of those genes. Use cases Functional analysis could be applied to data from different sources: Microarrays can be used in many types of experiments including genotyping, epigenetics, translation profiling and gene expression profiling. Gene expression profiling is by far the most common use of microarray technology. Both one- and two-colour microarrays can be used for this type of experiment. The output of a proteome analysis is usually a long list of proteins with a probability score and ideally a quantitative value associated. Thus, as well as with gene sets, some of the bioinformatics analysis of proteomics data include functional annotation and enrichment analysis, clustering, network or other statistical analysis or the analysis of post-translational modifications. Use cases Biostatistical analysis have always been a key component of biological, and specially genomics, studies. We have an extensive range of expertise in experimental design and statistics, and all our services can be tailored to meet the needs of your project: Use cases Our facility has experience performing a wide range of different statistical analysis: At the request of our users, we have been designing specialized software to solve specific biological problems. We have great expertise in writing in-house scripts in R, Python, Awk and Perl programming languages as well as bash command language. Functional Enrichment Analysis
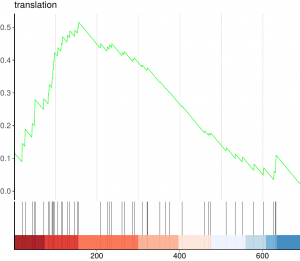 Given a priori defined set of genes (e.g., genes encoding products in a metabolic pathway or sharing the same GO category) and a ranked list of differentially expressed genes (e.g., ordered by their expression), the goal of GSEA is to determine whether the members of the set are randomly distributed throughout the list or primarily found at the top or bottom. The enrichment score (ES) represents the amount to which the genes in the set are over-represented at either the top or bottom of the list.
Microarrays Analysis
Proteomics
Statistics

Personalized software